-
FreeWheel Q1 ’17 VMR: Connected TV Viewing Share Up 16x to Top Spot
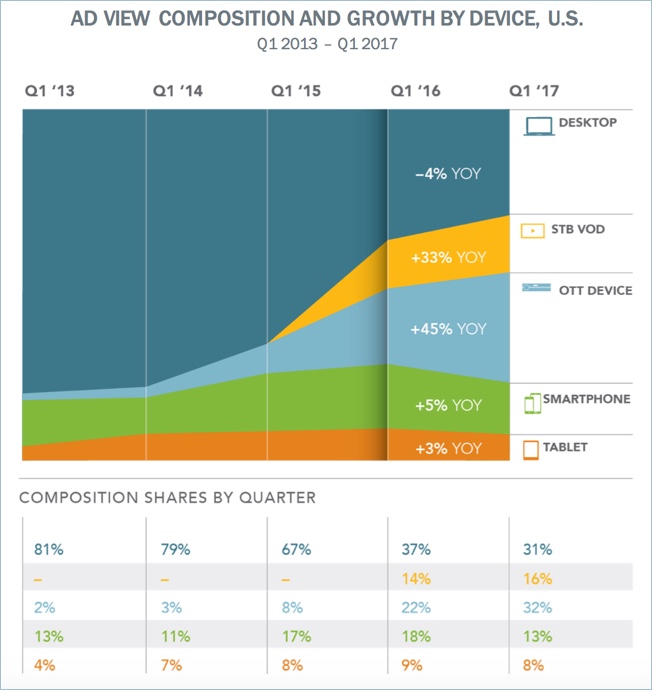
Connected TVs now account for more ad views in premium video content in the U.S. than any other type of device, according to FreeWheel’s Video Monetization Report for Q1 ’17, which was released at VideoNuze’s 7th annual Online Video Ad Summit in NYC Wednesday morning. Connected TVs, or “OTT devices” as FreeWheel calls them, claimed 32% of ad views in Q1, up 16x from their 2% share just 4 years ago.
In addition, set-top box VOD accounted for another 16% of ad views. Combined with connected TVs’ 32% share, nearly half, or 48% of premium ad views in the U.S. are now occurring in what FreeWheel calls the “new living room.”The shift toward connected TVs and STB VOD over the past four years has come at the expense of desktops, whose share of ad views dropped from 81% in Q1 ’13 to just 31% in Q1 ’17. Tablets’ share has doubled over the period, from 4% to 8%, which smartphones have stayed flat at 13%, even though they ticked up as high as 18% just one year ago.

Separate research from Leichtman Research Group 2 months ago indicated that 69% of U.S. TV households have at least 1 TV connected to the Internet. Within this group, the mean number of devices is 3.5 per household.
The FreeWheel data suggests that viewers’ use of these connected TV devices is intensifying. Full episode viewing and live streams continue to dominate all video ad views. Live grew from 16% share in Q1 ’16 to 24% share in Q1 ’17. As usual, live sports accounted for the lion’s share, 78% of live, but FreeWheel noted news increased to 16% share, almost double vs. a year ago.
Full episode player on-demand viewing was still the biggest source of ad views, with a 60% share, though this was down slightly from 63% a year ago. Entertainment accounted for 95% of FEP views. Short-form clips declined from 21% of all ad views in Q1 ’16 to 16% in Q1 ’17.
Overall, FreeWheel reported another double-digit percentage growth in both ad views and video starts, with the former up 15% vs. Q1 ’16 and the latter up 12%. Premium publishers are still mainly reliant on direct sales of their video ad inventory, with just over 90% of views monetized this way and less than 10% via programmatic.
FreeWheel highlighted a growth in both converged video ad buying across platforms and buying on guaranteed demographic segments. An analysis of a subset of FreeWheel customers revealed 40% of paid ad impressions were demo-guaranteed and FreeWheel sees this growing further.
As part of its Q1 VMR, FreeWheel also highlighted results of a survey it recently commissioned for its Council for Premium Video in which 52% of respondents said improving the ad experience is the number one challenge facing the video industry. Allaying concerns, FreeWheel once again found that mid-roll ad completion rates for FEP and live content were 98% and 97% respectively. This is also despite the fact that there’s virtually no difference in ad loads by devices, even though there’s more sensitivity to this issue when viewing on mobile devices.
The Q1 VMR also shares extensive data on the video viewing and monetization in Europe.
As always the VMR is available for complimentary download.Categories: Advertising
Topics: FreeWheel

