-
FreeWheel Q2 ’17 VMR: Connected TVs and Set-Top Boxes Account For Half of Premium Ad Views
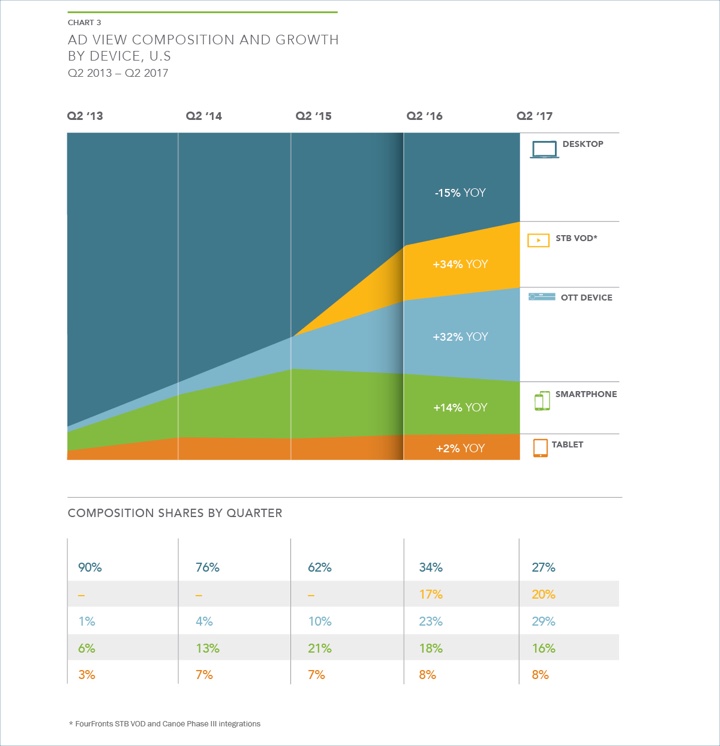
Connected TVs and set-top box delivered VOD now account for 49% of ad views on premium video, according to FreeWheel’s Video Monetization Report for Q2 ’17. That’s a small bump from the combined 48% they accounted for in Q1 ’17, but a huge increase from the combined 1% back in Q2 ’13.
In Q2 ’17, connected TVs drove 29% of ad views, up from 23% in Q2 ’16 while STBs drove 20% of ad views up from 17% a year earlier. Coincidentally, Roku, which has the largest share of the connected TV market and priced its initial public yesterday, has said that advertising and other “platform revenues” will be critical to its growth going forward.Once again, the move to connected TVs and STB VOD over the past four years has come due to the decline in desktop viewing, whose share of ad views dropped from 90% in Q2 ’13 to just 27% in Q2 ’17 (and was down from 31% in Q1’ 17). Tablets’ and smartphones’ share held relatively steady vs. Q1 at 8% and 16% respectively.

The other key aspect to the shift toward CTVs and STBs is that long-form viewing on these devices dominate. Fully 100% of STB viewing is long-form, while 74% of CTV viewing is long-form, with another 21% live and 5% short-form clips. All of this means that ads in premium video are increasingly being viewed in TV shows and movies on the big screen, creating an ideal environment for advertisers.
Overall, video starts in the U.S. grew 26% in Q2 ’17 vs. Q2 ’16 with ad views up 17%, another strong showing for the adoption of ad-supported premium video.
As usual, the VMR also contains lots of great data on syndication, monetization, including programmatic, more details on ad experiences and a breakout section on European premium video activity.
The VMR is available for complimentary download here.Categories: Advertising, Devices
Topics: FreeWheel

